2D Thermal Load Diagrams and Contours
2D element thermal loads have two diagram outputs: in-plane and gradient. Note that if the All Load Diagrams option is chosen then both will be shown superimposed.
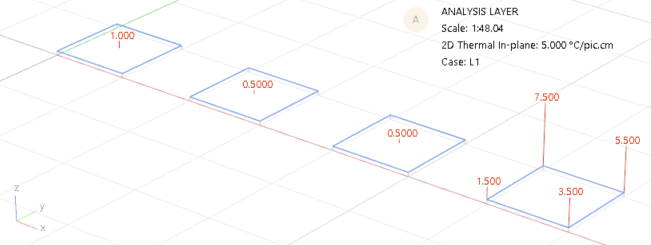
In these examples the four elements have the following loads:
 (2D thermal load table)
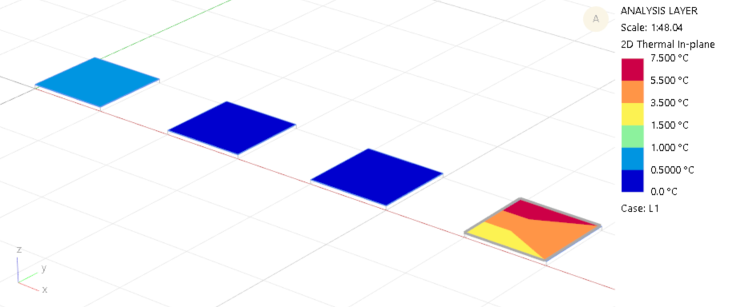
2D Thermal In-plane
The in-plane diagram and contour shows the average thermal change on the element or at the nodal locations.


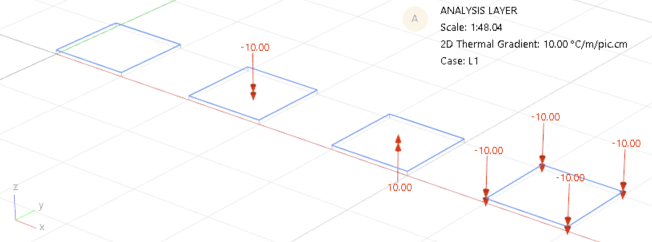
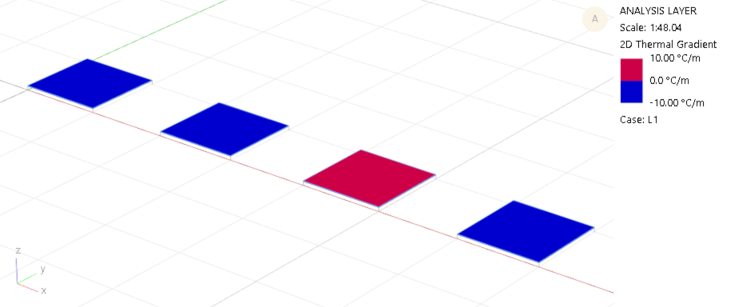
2D Thermal Gradient
The gradient diagram and contour shows degrees per unit length through the thickness of the element. In this instance the 2D thickness is 0.1 m, so the gradient from a one degree change is shown as 10.

