Running a simple static analysis on the portal frame
After creating the load cases, you can now run a static analysis, and view your results as a table or in the graphics window.
-
Select the Analyse all icon
 to run a linear static analysis.
 -
Your analysis is detailed in a report window.
Note: You can view this at any time in Reports tab of the Messages pane.
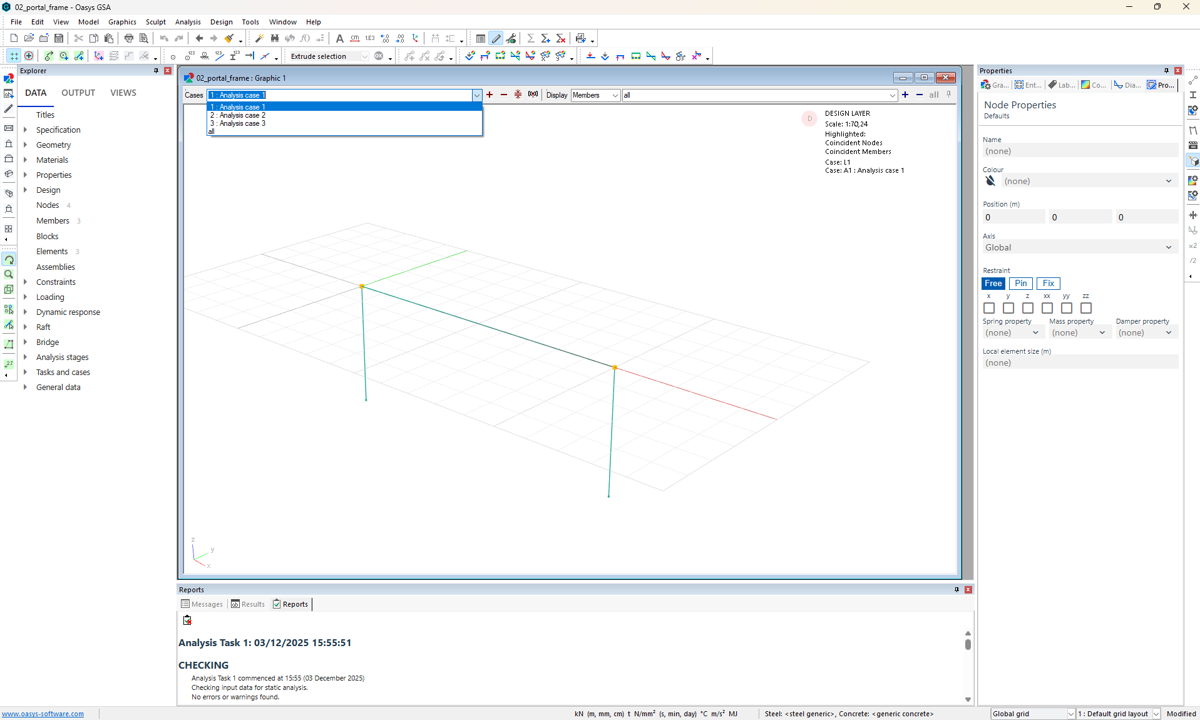
- Return to the graphics window. In the cases drop down select the Analysis case option. The load cases L1, L2, L3 are now Analysis cases 1, 2, 3.
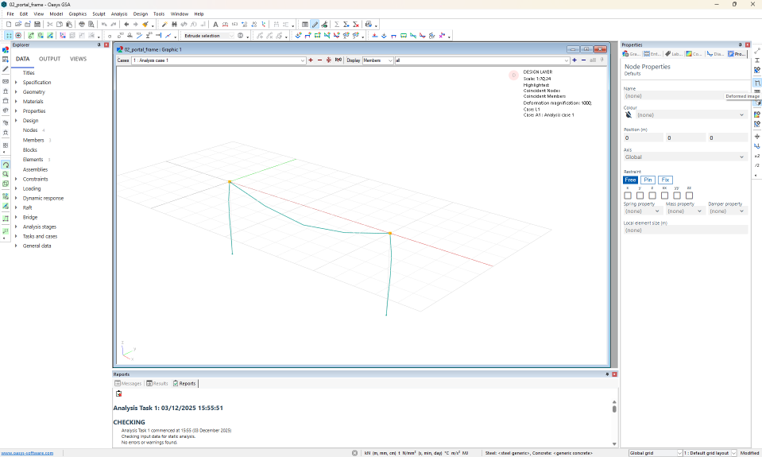
- Click the Deformed image icon
 to show the deformed shape.
- bending moments are visible via the Bending moment icon

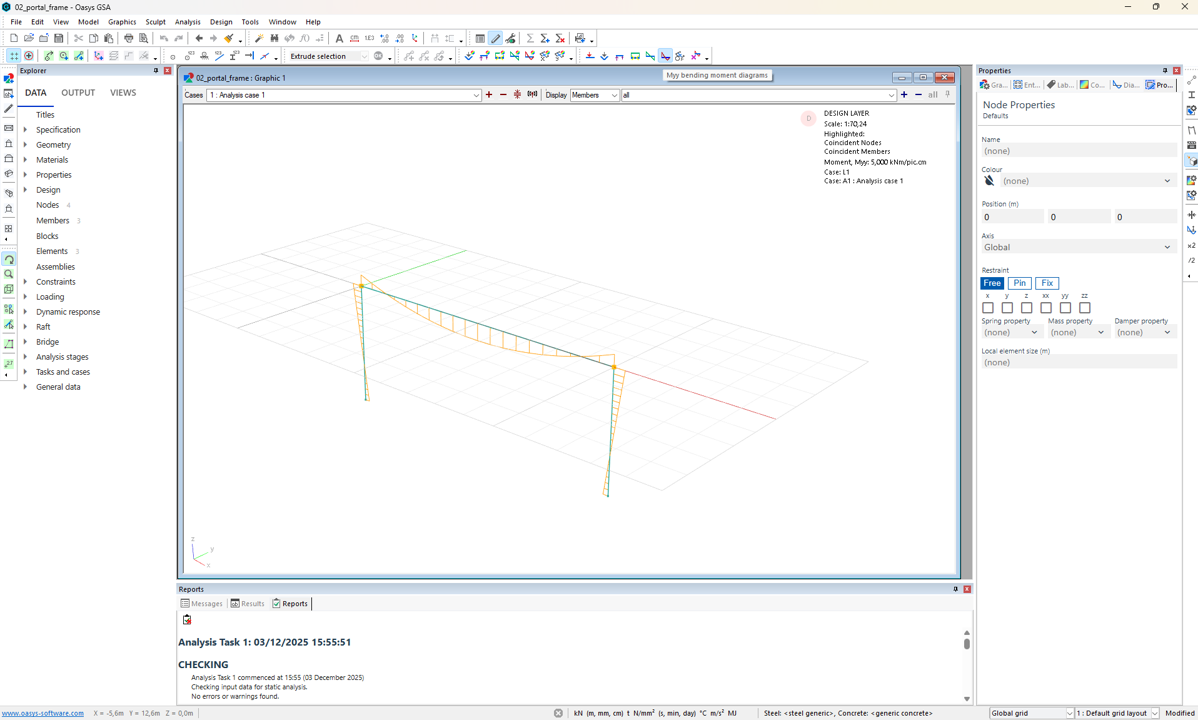
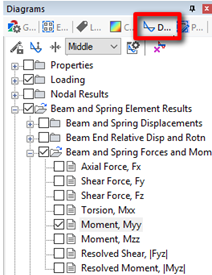
Other common results options are available to view in the diagrams toolbar:
![]()
- Go to the Diagrams tab of the Properties pane to access all of the available view options
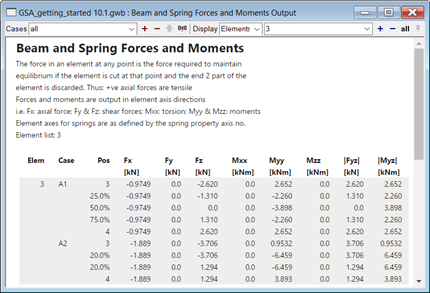
Displaying results as a data table
- Go to Explorer pane > Output > Beam and spring element results > Beam and spring forces and moments
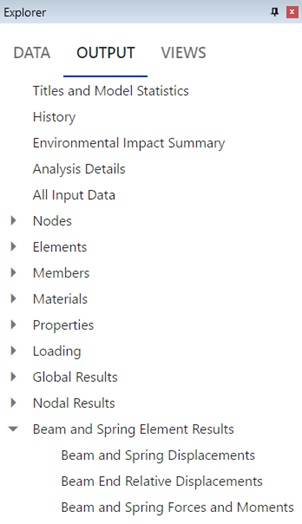
- This will open a table of results. Select Elements in the drop down at the top of the window. Type '3' to show forces on the cross-beam.