Viewing model results
This section accompanies the the Helical staircase example models np<!---insert link to model here--->. Try these steps with your own model already analysed to learn more about view settings.
Most results can be viewed in either the Analysis or Design layers.
In the Analysis layer results are displayed on Finite elements, whereas in the Design layer results are displayed on top of Members. Some results, such as Steel design results, are only available for members and, therefore, only viewable from the Design layer.
You can also toggle between layers to find the visualisation option you prefer.
Diagrams
Contours show model details and results by drawing shapes on top of the geometry. This entry includes some of the most commonly used diagrams.
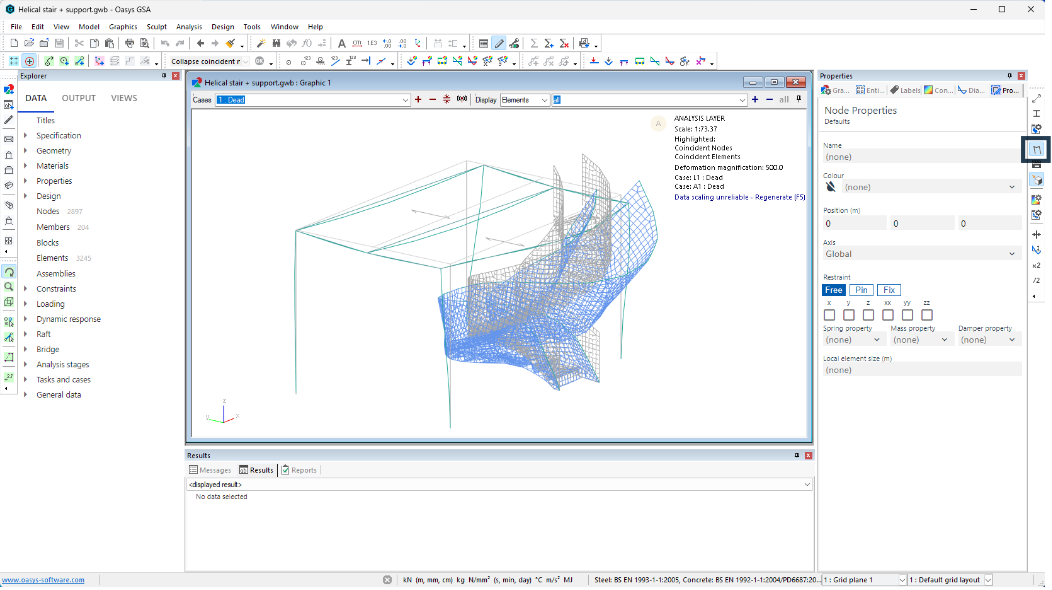
Deflected shape
To view the Deflected shape in Graphic view, click the Deflected shape icon  and select the case to see its related results.
Use the following tools to adjust the magnification of the deflected shape.
| Icon name | Icon image | Associated action |
|---|---|---|
| Rescale data | Refreshes diagram according to the data so that the results are proportionate. | |
| Double size of diagrams | Doubles the magnification of diagrams from current scale. | |
| Halve size of diagrams | Reduces size of diagrams by half current scale. |
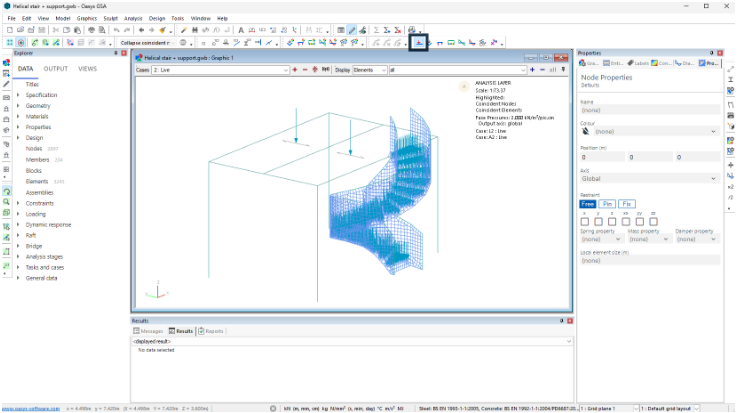
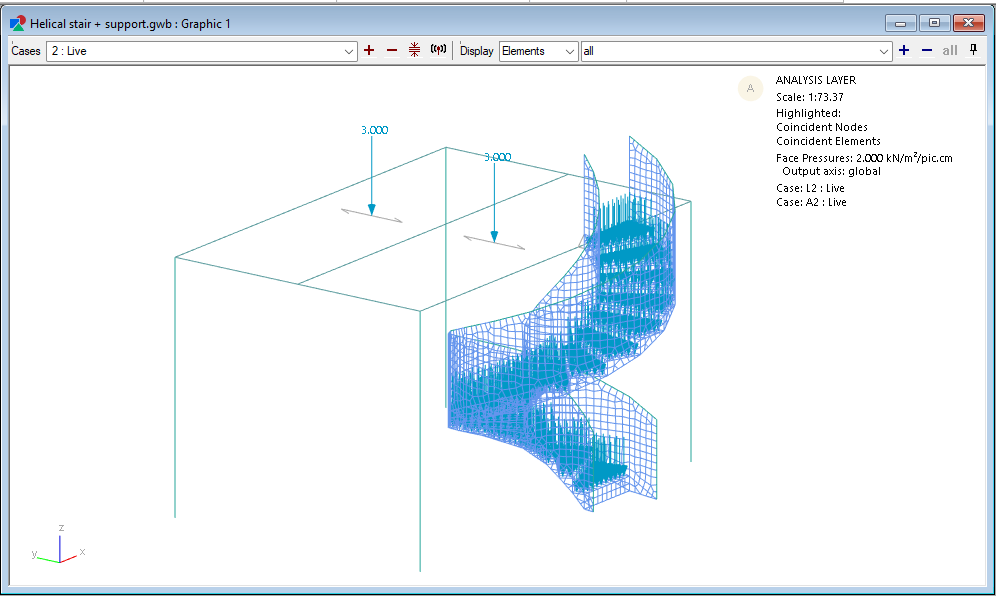
Show all loads diagram
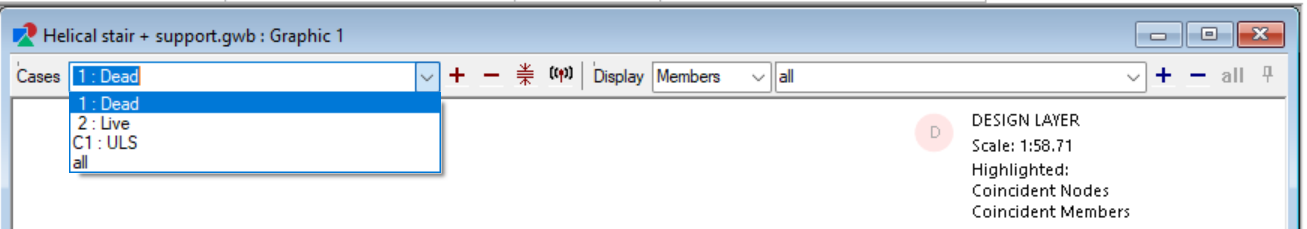
From the Cases drop down menu, select all to view a diagram of all the loads as applied to an analysis case. Similarly, you can select other cases from the options.
From the Cases drop down menu, select All to view a diagram of all the loads as applied to an analysis case. Or use the All load diagram icon  and select the relevant Case from the drop down menu to refine your view.
Use the Annotate cursor mode by either clicking on the icon  or keyboard shortcut A. Select the entity to see load magnitude.
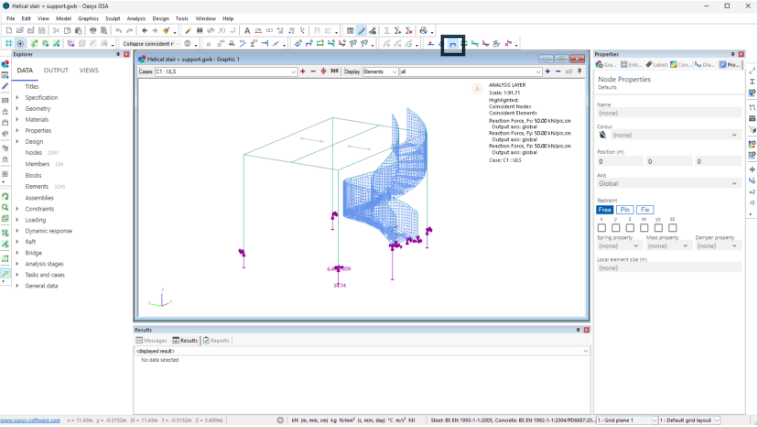
Reactions
To view a diagram of the base reactions for an analysis case, use the Reactions tool icon  and select the case(s) from the drop down menu to display their reactions.
Use the Annotate cursor mode by either clicking on the icon or keyboard shortcut A. Select the entity to see the reaction magnitude.
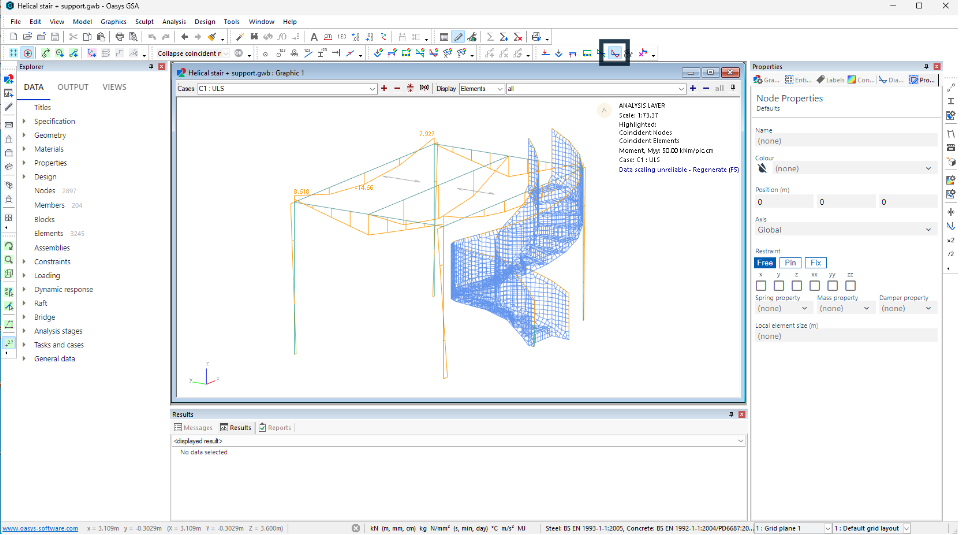
Bending moment and shear force diagrams
Diagrams for bending moment, axial and shear forces can be viewed using the following tools.
![]()
Use the Annotate cursor mode by clicking on the icon or with keyboard shortcut A. Select the entity to see the magnitude.
Contours
Contours show model details and results by colouring the geometry. This entry includes some of the most commonly used contours.
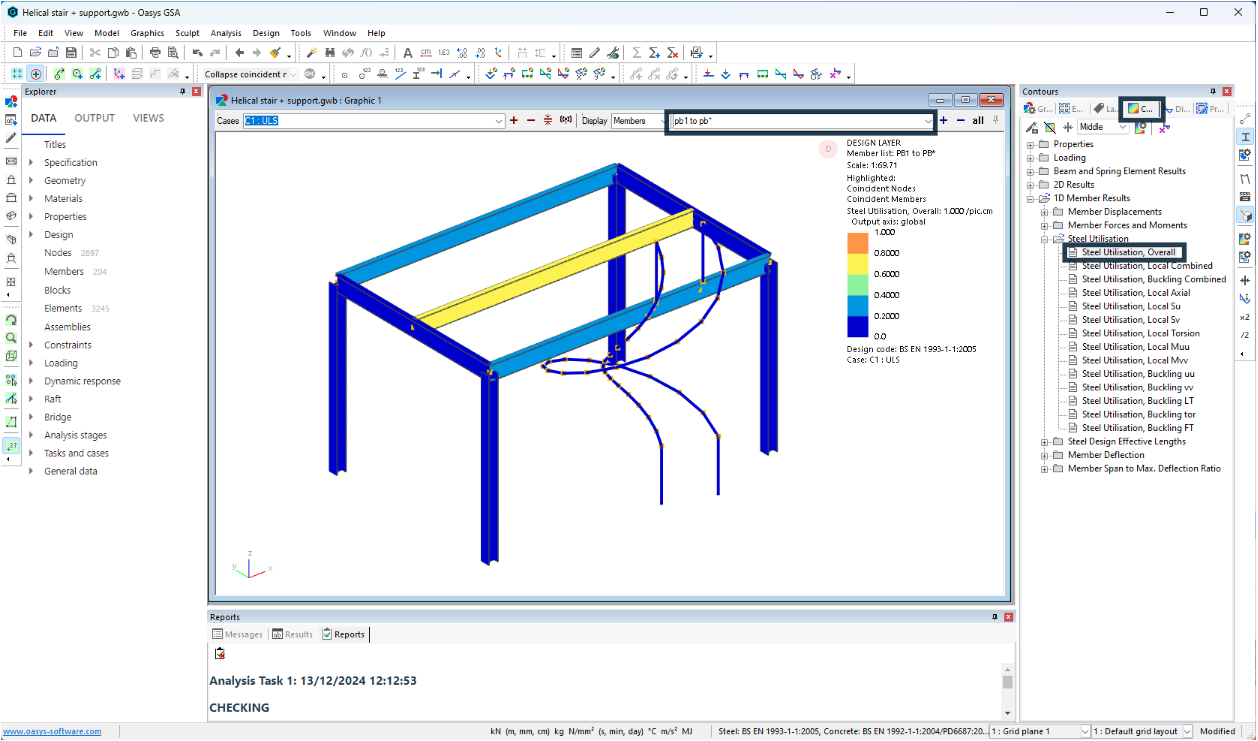
Steel design results
Steel design is done in the members level so its contours are only visible from the Design layer.
Ensure that you’re in the Design layer by checking the top right corner of the Graphic view. To change layers, right click the screen or use the keyboard shortcut Ctrl+Alt+D.
To display only the 1D members type pb1 to pb*. In this view, only the entities that are assigned to a 1D section property will be displayed.
Browse to the Properties pane and click on Contours to display all entities that can be contoured. Go to 1D Member results > Steel utilisation > Steel utilisation, Overall to see the the Overall utilisation.
From this menu other related contours such as Steel design effective lengths can also be viewed.
Use the Annotate cursor mode by clicking on the icon or with keyboard shortcut A. Select the entity to see the magnitude.
Go to Contour settings by clicking the icon  to refine the view or to modify the scale and other visual aspects.
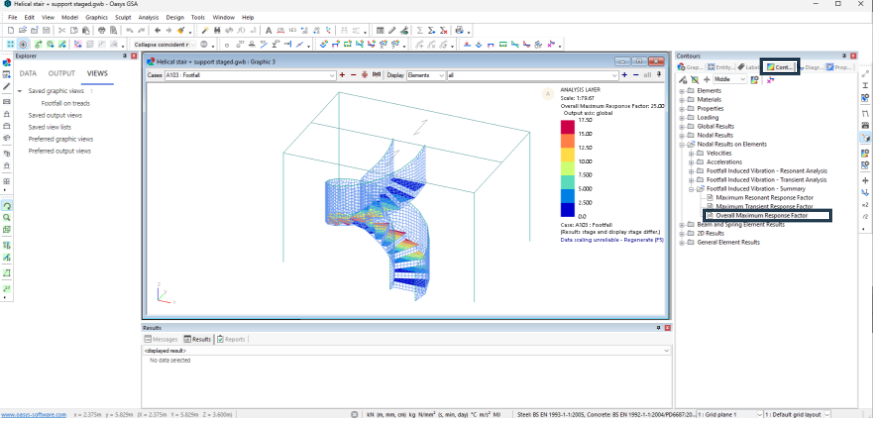
Footfall analysis contours
Footfall results can only be contoured in the Analysis layer.
Ensure that you’re in the Design layer by checking the top right corner of the Graphic view. To change layers, right click the screen or use the keyboard shortcut Ctrl+Alt+D.
Select a footfall analysis case from the drop down menu.
Go to Contour settings icon and follow Nodal results on elements > Footfall induced vibration - Summary > Overall maximum response Factor. From this location the scale and other visual aspects of the contour can be modified in a single step.
Output views
Output views show model details and results in a tabular or text format. This entry includes the most commonly used Output views.
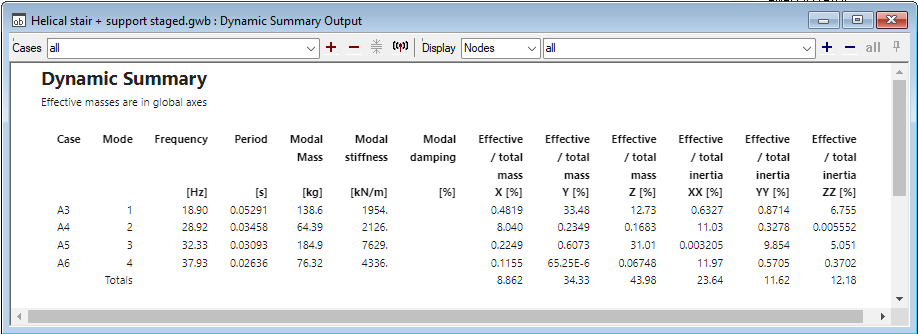
Dynamic analysis summary
In the Data explorer, go to Output > Global results > Dynamic summary for a summary in tabular format including the effective masses in global axes organised by cases.
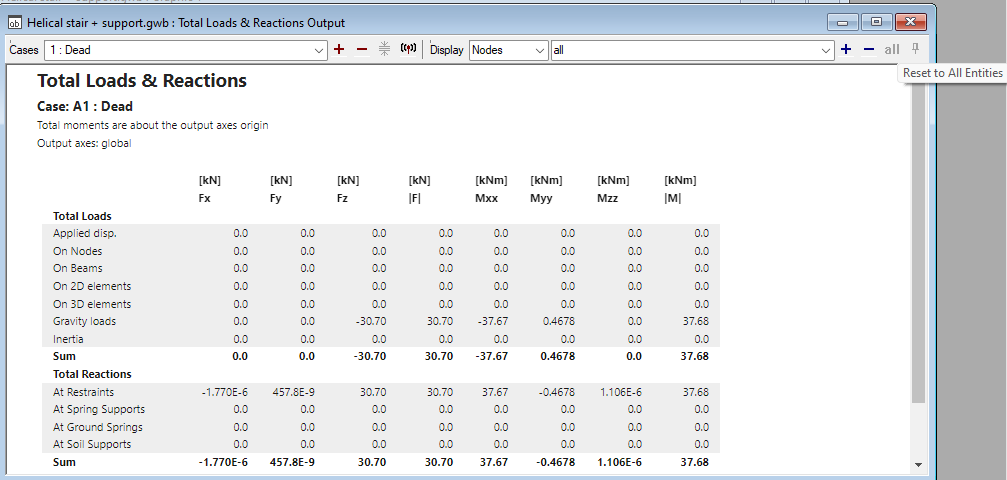
Total loads and reactions
In the Data explorer, go to Output > Global results > Total loads & reactions.
The report is created in tabular format and is organised by cases. Select Cases and Nodes from the drop down menues to refine the report output.
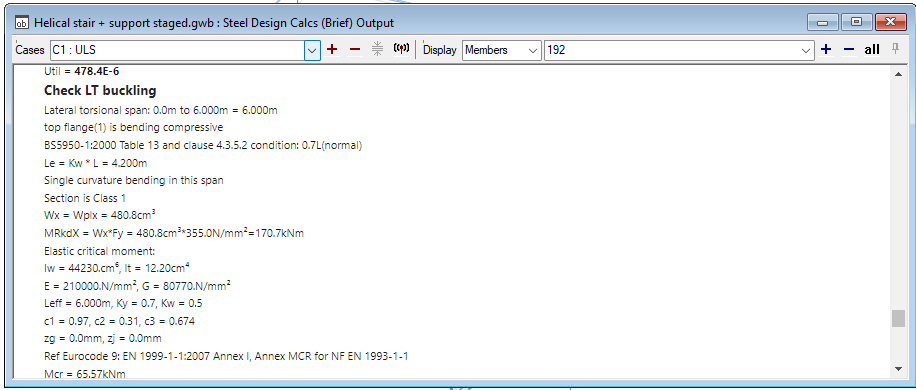
Steel design calculations
Detailed calculations for your Steel design results are available in the Output views option.
Select the relevant member in the Graphic view. Then proceed to the Data explorer to follow Output > 1D Member results > Steel design calcs (Brief). Further refine results by selecting Cases from the drop down menu.