Seismic Analysis: Response Spectrum Analysis
Response spectrum analysis is a method for estimating the seismic response of a structure from a set of modal dynamic or Ritz analysis results along with a response spectrum which capture the frequency content of an expected earthquake.
Response spectrum
A modal response spectrum analysis is a statistical approach that looks at the elastic response of the structure taking account of the response in all the calculated modes. While this gives a good estimate of maximum values of displacement and force/moment it effectively only produces an envelope of these values, so it can be difficult to examine all the results of interest or combine these results with those from other analyses.
The modal analysis should contain sufficient modes to capture the dynamic characteristics of the structure. In general the sum of the effective masses (in the relevant directions) should be around 90% of the total mass of the structure. For tall structures it is typically easier to capture the effective mass in the horizontal direction than the vertical this being a reflection of the relative greater flexibility in the horizontal direction.
A response spectrum is a curve of the maximum acceleration response of a series of single degree of freedom system oscillators of different natural frequencies with a given level of damping to a given excitation.
So starting from the seismic record (acceleration time history) as shown below and a given level of damping
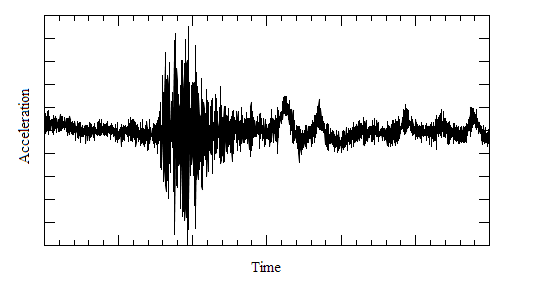
The response spectrum is then the maximum acceleration response of a single degree of freedom system to the excitation.

In practice the response spectrum is usually code defined. In this case the curve is an envelope of the spectra that would be calculated from a series of possible earthquakes. The actual values are determined from a selection of parameters which include such factors as the seismicity of the region, the ground conditions, the importance of the building, etc.
The response of the structure in any direction for a given mode can then be determined with reference to the frequency, participation factor and the spectral value as
In this equation:
is known as the modal multiplier.
Modal combinations
Once the responses in each mode are calculated they must be combined over the modes. A number of different combinations are provided
- Absolute sum – simple combination, but overestimates the response
- Square Root Sum of Squares (SRSS) – better than the absolute sum but can underestimate the response where there are closely spaced modes
- Complete quadratic combination (CQC) – the most commonly used method which allows for interaction between closely spaced modes
where
If the damping is the same for all modes
- Modified Rosenbluth – an alternative combination, similar to CQC
where
The same combination can be used for any modal response, such as displacement, force or base shear.
Seismic total forces and moments
In addition to the code defined procedure GSA carries out some overall checks of total forces and moments (overturning and twisting moments).
We define an origin for our calculation which is at the centre of mass on plan () and at the base level () of the structure.
Then, where the subscript refers to nodes, to modes and k the excitation direction
Where is the nodal mass, the nodal inertia, and the modal displacement and rotation and is node coordinates and
Where is the participation factor for mode in the direction and is the spectral acceleration for the frequency corresponding to mode .
And
Then if is the direction the base shear from this calculation is , the overturning moment is and the torsional (twisting) moment is .
When the origin of the calculation is changed to the global origin then these calculations give total dynamic forces moments.
Other results
The (dynamic) base shear for a given mode can be calculated from the response spectrum and the effective mass
The storey drift is defined as
where is the storey height.
Two useful results are the ratio of effective mass in the modes considered to the total mass and the base shear coefficients.
Limitations
The response spectrum method is essentially a statistical method which aims to give maximum responses, so it does not provide a consistent set of results but rather an envelope of the maximum results. This can lead to difficulties in interpreting and using the results of a response spectrum analysis. So
- Element forces results are from combining the modal forces, so these are not the same as calculating the results from the response displacements at the nodes.
- Storey drifts are not the same as the difference in response between floors.
- Displacements, etc. in transformed axes will be conservative (as maximum is combined with maximum ).
Any derived results should from a response spectrum case should be used with caution as these will tend to over-estimate the actual effect. So for example in RC Slab in-plane forces and bending moment will both be made positive while design may require bending moments of the opposite sign to the in-plane forces.
Details of results available and how they can be viewed are in the Results Display Options section.