Moment-Stiffness-Curvature
The Moment–Stiffness–Curvature chart shows the variation of curvature and bending stiffness of a section with increasing bending moment, for a specified bending direction and axial force.
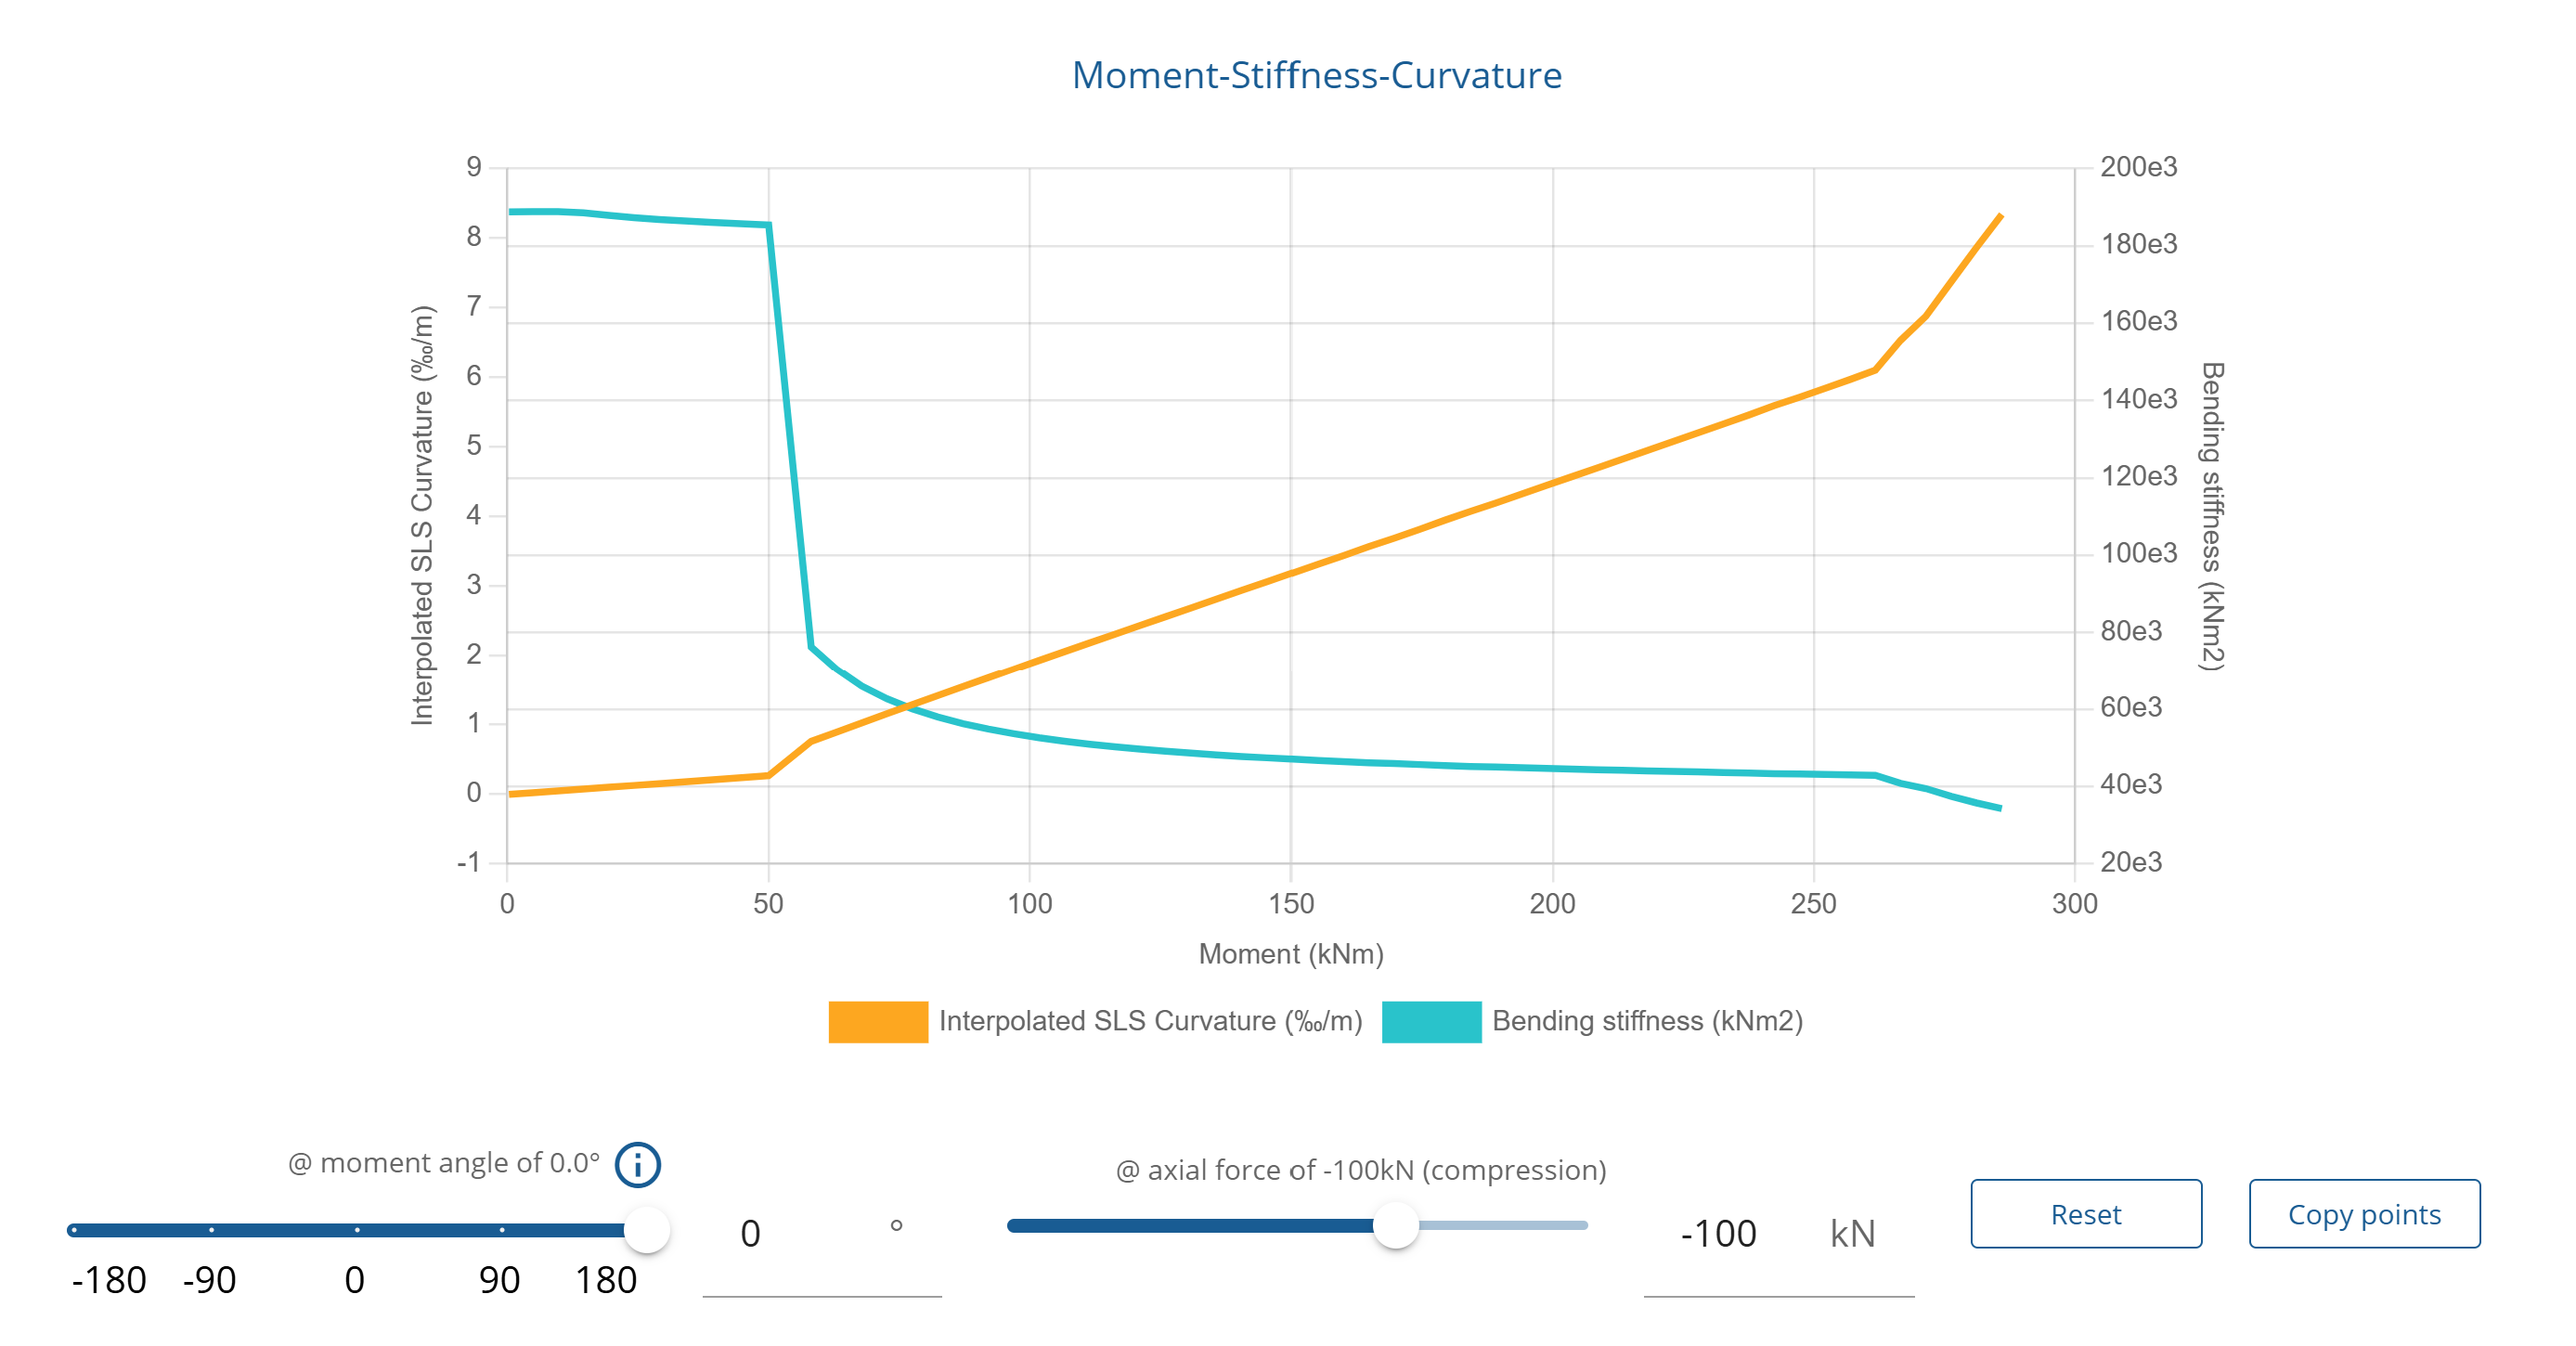
What the chart shows
- Moment (M). On the horizontal axis, the resultant bending moment at a user-specified angle.
- Curvature (κ). On the primary vertical axis, the interpolated SLS curvature corresponding to the applied moment and bending direction.
- Stiffness (EI). On the secondary vertical axis, the effective (secant) bending stiffness, calculated as:
How to use
The chart is intended for serviceability limit state (SLS) assessment, for example:
- Identifying the cracking moment.
- Identifying an appropriate equivalent bending stiffness for displacement calculations.
- Understanding stiffness reduction due to cracking.
- Comparing section behaviour for different axial forces or bending directions.